
A sales dashboard with the AI and the sales team on one screen
Separating what the AI is doing from what the sales team is closing usually means cross-referencing spreadsheets from different sources — one for the AI SDR, another for the sales reps CRM. The SDRBOT.ai sales dashboard calculates both sides from the same real tables of conversations and deals: how many leads each agent (AI or human) received, how many they converted, how much revenue they produced, and how that compares with other periods — all while you pick the time window you want to look at.
Build my SDR free →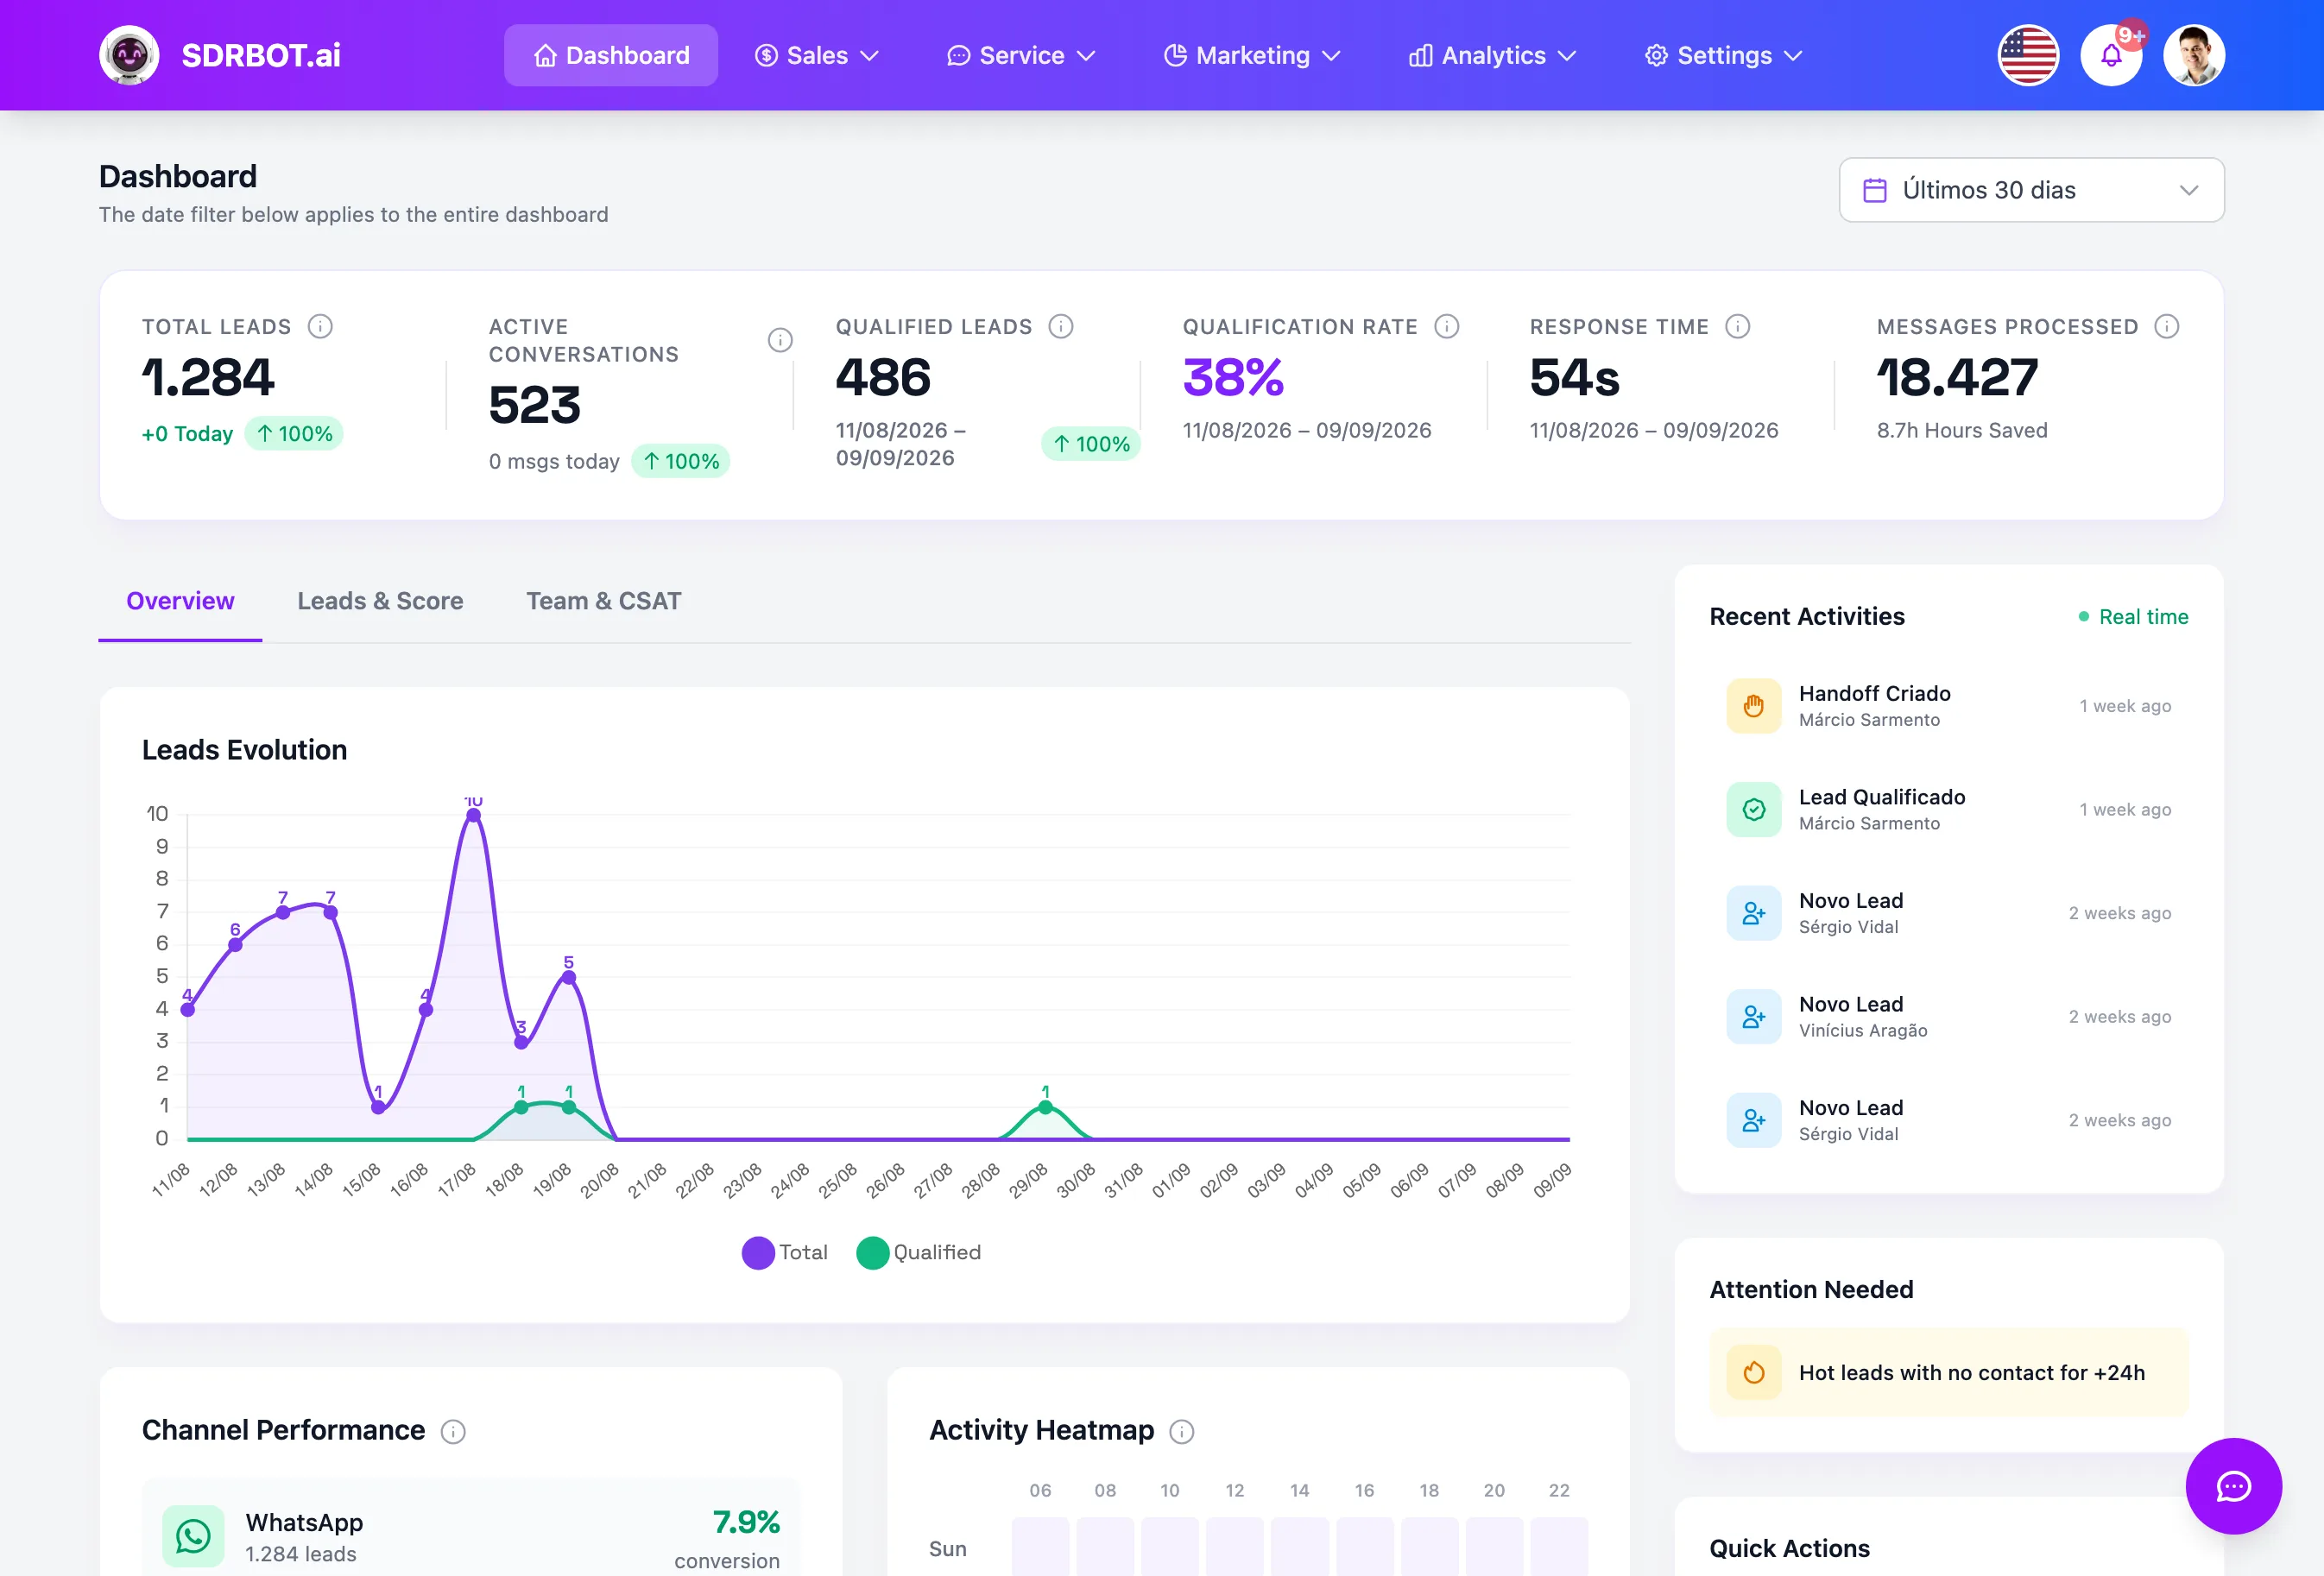
Every agent with their own number, the AI included
The dashboard treats the AI SDR as one more agent inside the account, with metrics of its own calculated straight from the messages it sent and the handoffs it created. Each human sales rep — whether a registered agent profile or someone who only shows up because they received handoffs — also enters with metrics of their own, all for the same chosen time interval.
That avoids the problem of a dashboard that only shows a total message count without saying who sent what: here you can open a specific sales rep's card and see, separately, the AI SDR's card, without blending the two numbers into a generic average.
A sales rep who does not yet have a formally registered agent profile, but has already received handoffs through the Service Center, shows up in the dashboard just the same — the platform pulls those users straight from the deals table, without requiring manual registration before it starts counting metrics for them.
The AI on one side, the human team on the other
Beyond the individual cards, there is a direct comparison: on one side, leads received, converted and lost, revenue produced and conversion rate for all human sales reps combined, calculated from the real deals; on the other, messages sent and received and handoffs created by the AI, coming straight from the conversations.
On top of those two sides, the dashboard assembles up to six written readings automatically — about automation volume, pipeline efficiency between the AI and the human close, conversion performance, revenue produced, missed opportunities and the collaboration between the two sides — calculated by rule from the period's numbers, not written by a language model.
Change the period and the number changes at once
You choose among today, week, month, quarter or year, and every card, the comparison and the top performers ranking recalculate for that specific window, pulling straight from the real tables of messages and deals — not from a cached number of days ago.
This is not a scoreboard that refreshes itself on screen while you watch: the recalculation happens when you change the period filter or reload the page, not with every new message arriving in real time. For following the day closely, the today filter already does the job, without leaving a screen open waiting for a number to move.
Top performers pulled straight from the deals
The top performers ranking on the dashboard is not an estimate: it is assembled from each sales rep's handoffs in the chosen period — total deals received, how many were won or lost, revenue summed and conversion rate — ordered by the revenue each one produced.
Each position in the ranking also carries the sales rep's satisfaction score (CSAT), where one exists, so the manager does not have to open a separate screen to see whether the person who sold most in the period is also leaving customers satisfied or just pushing volume.
Because the calculation depends only on deals already recorded in the system, a newly arrived sales rep who has not closed anything yet appears in the dashboard with no position in that period's ranking, rather than entering with a forced zero mixed in with the rest.
What changes for your team
- The AI counts tooThe AI SDR shows up as one more agent, with metrics of its own.
- Automatic comparisonLeads, conversion and revenue for AI and humans, side by side.
- 5 time windowsToday, week, month, quarter or year, without leaving the screen.
- A real rankingCalculated straight from closed deals, never estimated.
Frequently asked questions
Does the sales dashboard refresh itself in real time?
It does not keep updating an open screen like a live scoreboard — the numbers are recalculated when you change the period filter or reload the page, straight from the real tables of conversations and deals. To follow the day, the today filter already brings the most recent number available.
Does the AI appear separately from the human sales reps?
Yes. The AI SDR has metrics of its own and also enters a dedicated comparison alongside the human sales reps, with leads, conversion and revenue on each side — without blending the two into a single average that hides who did what.
Where do the dashboard revenue numbers come from?
From the real deals marked as won by the sales reps, with the deal value recorded in each one — not from a generic usage table or an estimate. The same holds for leads received, converted and lost. The revenue attributed to the AI in the comparison, in turn, stays at zero in this calculation, since whoever closes and records the deal value is always a human agent.
Can I see the performance of one specific sales rep?
Yes, each sales rep has a metrics card of their own in the dashboard, and also appears in the top performers ranking for the chosen period, with revenue produced, conversion rate and satisfaction score where available for that person. You can also compare that specific sales rep against the team average for the same period, without building that math on the side.
Works together with
Built for: Car Dealerships SaaS & B2B Franchises